| Attachment | Size |
|---|---|
| 103.32 KB | |
| 33.28 KB |
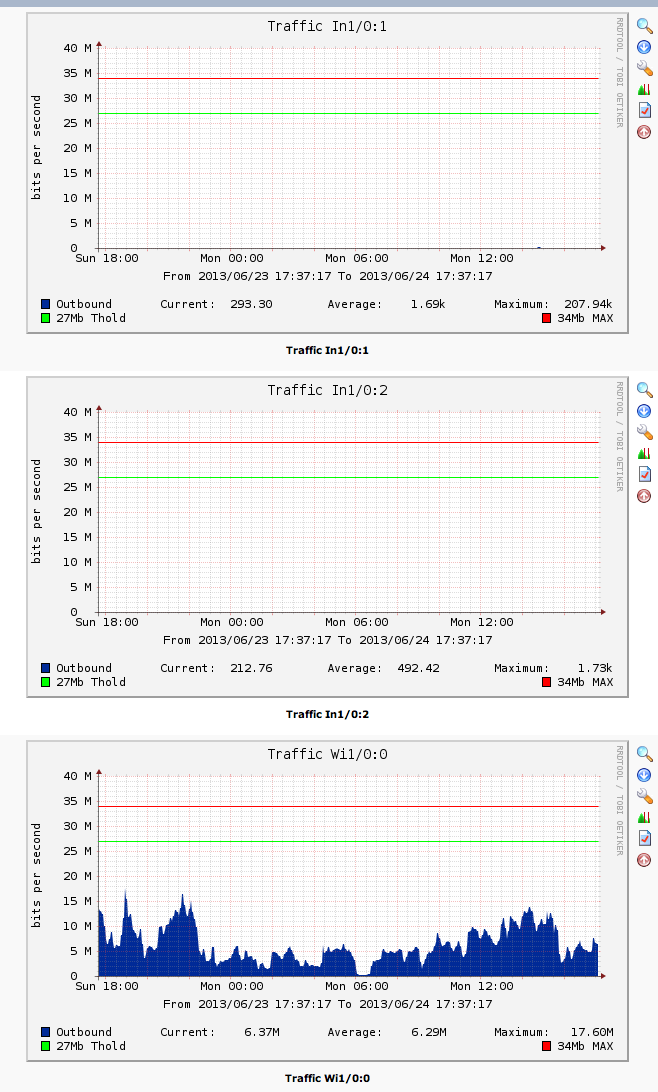
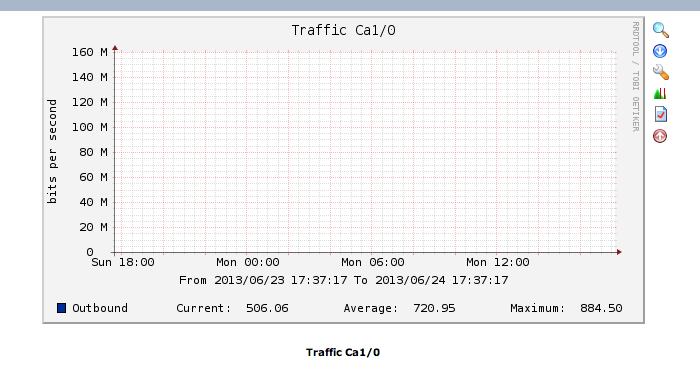
I just deployed a new Cisco 7225VXR D3 enabled CMTS to a new market(no existing service). We've only deployed D3 modems so all are registered wideband. Now we outsource our "CPE monitoring" to an outside company. They present us with nice red light/green light of SNR, utilization, etc.. But I have my own internal Cacti server that will graph the same data, just not as easy on the eyeballs as red=bad and green=good. Now, when I use Cacti to build graphs one would assume that each cable 3/0*(example). would include Integrated Cable 3/0:0-3 AND Wideband3/0:0. However I found this isn't the case. I found that only "integrated cable" bandwidth shows up on the physical Cable3/0 interface. The only way around this is to build aggregate graphs in Cacti, not an issue for me but asking $outsourced_monitoring_system to change how they operate isn't as easy.
My question is there any way to tell the CMTS to include the Wideband traffic in the physical Cable interface graph. I'll attach a few screen shots to make more sense.
SNMP/CLI output for "interface cable x/y" will be the aggregate narrowband traffic for this mac domain
SNMP/CLI output for "interface integrated-cable x/y:z" will be the narrowband traffic on that particular channel
SNMP/CLI output for "interface wideband-cable x/y:z" will be the aggregate wideband traffic for this particular bonding group
Are you wanting to monitor the total utilisation of each downstream channel including all NB and WB traffic? (As you say, you cant really determine this from the output of the above commands or associated SNMP counters)
If so, I believe the command you are looking for is
show controllers integrated-Cable x/y counters rf-channel
And the associated mibs are at
CISCO-CABLE-WIDEBAND-MIB::ccwbRFChannelMpegPkts
The naming of the mib makes it sounds like this might be wideband only traffic, but from my testing it is actually the aggregate of NB and WB on each DS channel.
Also note, you must use SNMPv2 to poll this MIB, it doesnt work with SNMPv1
This is exactly what I was looking for, thank you. The only problem is(I haven't confirmed) but it look like when you poll via SNMP it is only a packet counter not a byte counter? I was hoping for a byte counter so I could use SNMP to graph. Guess it's time to start building a script since the output on the CLI shows bps/rf-channel.
Thanks again!
Yes it is a packet counter, but in this case it's not like a typical one that counts variable sized packets.
This one is an MPEG packet counter. MPEG packets are always 188 bytes in size.
As such you can convert the MPEG pps to IP bps without much problem :-)
Here's an example :
take the MPEG pps * 188 (gives you IP Bps) * 8 (IP bps) / 1024 (to IP Kbps) / 1024 (to IP Mbps)
The max I see on my graphs is roughly 25500 pps. Lets run this through the maths above :
25500 * 188 * 8 / 1024 / 1024 = 36.5Mbps which is very roughly right for my 256QAM DS.
Might not be 100% accurate, but close enough!
I dont even bother converting to bps. I just graph the pps and if you set your max graph threshold to 25500 it is effectively giving you a % utilisation readout.
Yeah, the bummer part is that either way, you have to aggregate graphs - whether it's each DS channel or each NB and WB interface. At least from what I've discovered so far. Good info though.
The guys in my company didn't like going through all the graphs, even though I have them separated by mac domain, so with Cacti 0.8.8a, using the create aggregate graph function is really nice. My guys like this one. These graphs come from the Cisco CMTS host template which can be had from Cacti's site.
This was an exceptionally helpful post to get me kicked in the right direction to graph aggregates of my DS channels. The next thing I am struggling with is mapping the number of 'Modems per Upstream' as included in the Cacti Cisco CMTS plugin.
Has anyone had any success doing this?
My goal is to graph all my Modems per Upstream, and then set THOLD values such that if I lose a larger percentage of modems, I send off alerts. So far, I can't get past creating the graphs, as the graph template keeps erroring out as shown in the attached screen shot ... Any ideas ?
RRDTool Says:
ERROR: parameter '#00CF00FF' does not represent a number in line AREA:#00CF00FF:Registrered Modems
It looks like you are missing data sources. Take a look at mine, I do exactly what you want to do. I use threshold to email me when a specific percentage of modems drops after 10 or 15 minutes (the delay is to allow someone to replace a tap or whatever. It eliminates a lot of false alerts.)
Anyway, I think you can add the data sources manually, but if I recall, there is an xml file for doing this.
ODG
Download a copy of Observium, it is pretty good at finding everything to instrument (except snr) I use both cacti and observium